Quickie: Feb. Corrected PCE Inflation 1.8%
In Which Dr. John (Quickly) Explains Why February PCE Inflation, corrected by removing Fictitious Owners' Equivalent Rent (OER), was 1.8%, below the Fed's target, not 2.5%.
Summary: Friday’s PCE report, corrected by removing the fictitious Owners’ Equivalent Rent (OER) component that makes up 15% of the index, came in at 1.8% for the 12 months ending in February, not the 2.5% you see in the headlines. It has been below the Fed’s 2% target for the past three months. It’s time to lower rates.
February PCE Inflation 1.8%, Below Fed Target
Yesterday, the BEA reported that PCE inflation for the twelve months ending in February was 2.5%, above the Fed’s 2% target. Many took that to mean the Fed should keep interest rates higher, longer. That would be a mistake. For reasons I have explained over the past year, both the CPI and PCE inflation measures are biased upward because they assign a huge weight to a fictitious number known as Owners’ Equivalent Rent (OER) that should not be in the index at all. After removing OER from the index, February PCE inflation was just 1.8%, under the Fed’s 2% target for the third month in a row.
Do the Math
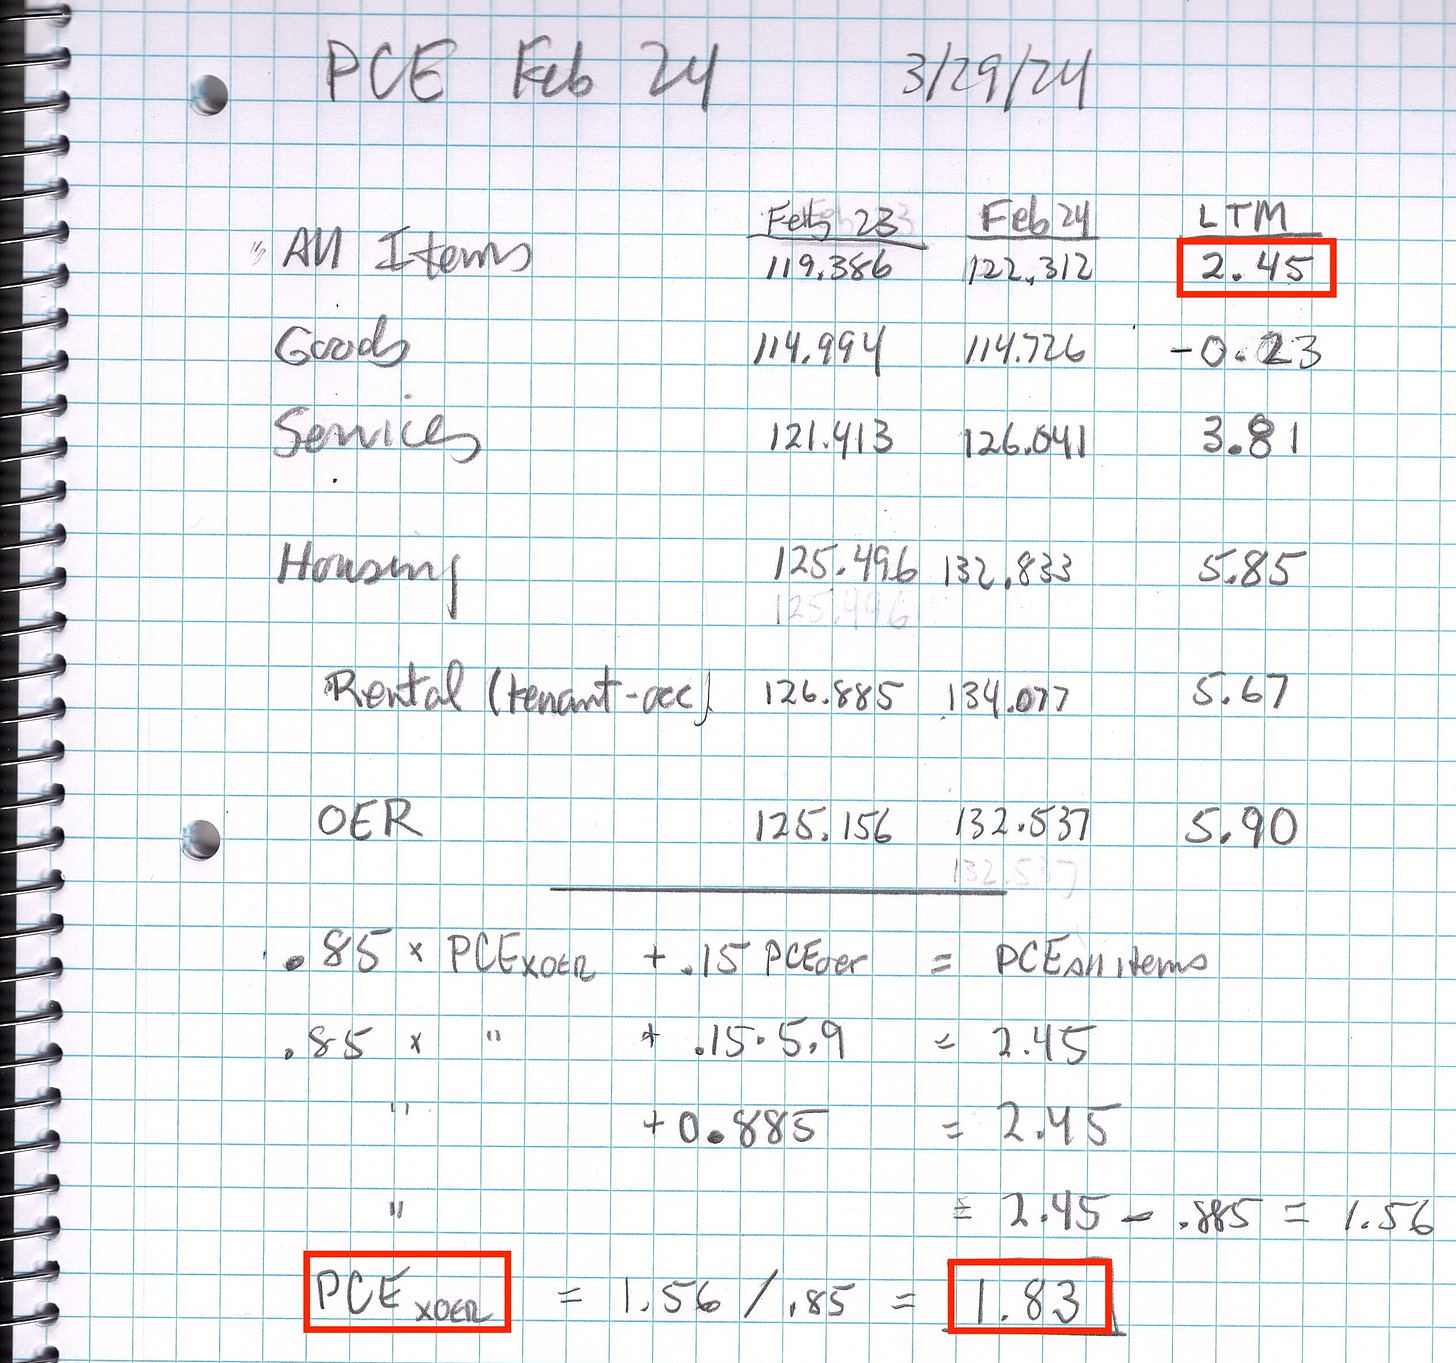
The correction to the index is so simple it can be done on the back of an envelope—actually a quad-ruled notebook—as shown above. To make the calculation, you first have to obtain the data for the February 2024 and February 2023 index levels from the detailed monthly PCE price indexes in Table 2.4.4U of the National Income and Product Accounts st the BEA website.
In the top row of the graphic you will see that the All Items PCE index increased by (2.45%) in the 12 months between February, 2023 (119.368) and for February 2024 (122.312), which equals the 2.5% reported by the BEA. The Goods component of the index fell by (-0.23%) and Services increased by (3.81%). Within services, Housing prices rose by (5.85%). About one-fifth of those housing costs are legitimate, they attempt to measure the size of the checks that actual tenants send to actual landlords to pay the rent. Those checks increased by (5.67%) in the year ending February. The remaining four-fifths of housing costs represent OER (“Imputed rental of owner-occupied nonfarm housing” in line 160 of Table 2.4.4U), somebody at the BEA’s guess of the size of the check that a homeowner would have to send to themself if they rented their own house from themself. (Read that last sentence slowly.) As you can see in the graphic, OER inflation was (5.90%).
The remaining rows show you how to do the arithmetic to translate the All Items figure (2.45%) into PCExoer (1.83%), my corrected inflation rate for All Items excluding OER.1 (OER has a weight of about 15% ( the 0.15 in the calculations). The corrected figure for February (1.83%) was below the Fed’s 2% target for the third month in a row.
Beware Official Statistics
I will close with three thoughts:
OER carries the biggest weight in both the CPI and PCE indexes. It makes no sense at all, and should be removed from the index. But don’t expect the Fed and BEA to admit that because it’s imbedded in the very roots of the national income accounts and embodied in formal agreements among the member countries of the OECD. My guess is that OER was put into the definitions partly because some economist decided GDP should attempt to use it to measure “economic welfare” rather than current production (the P in GDP),2 and partly to make it more convenient for the hard-working economists in government agencies to compare housing costs between countries like the U.S., where 70% of households own their own home, and Germany, where 53.3% of households pay rent to a landlord. So don’t hold your breath waiting for Powell to confess that inflation is already below target and they are lowering rates at the next press conference. They won’t do that until the next unpleasant event (Silicon Valley Bank moment) forces their hand.
It’s worth your time to think what this implies about all of the other economics reports that come across your desk next week. The $2.3 trillion of OER3 buried in the belly of the GDP accounts, also pollutes every number derived from the GDP accounts, including Personal Consumption Expenditures, Personal Income, Per Capita Disposable Income, and the National Savings Rate.
After all of my whining about OER over the past year, I want to point out that it’s not the only anomaly in the economic reports. It’s just the most glaring one at the moment because of the important role the CPI is playing in both policy and the financial markets. In general, it is foolish to take any of the official statistics as the final word on the economy. You have to read the footnotes. You have to do your own work.
Dr. John
I am showing you the arithmetic so that next month you can calculate it yourself because I am certain that you are tired of reading about it and there are more pressing matters I want to write about.
The fact that GDP is a lousy measure of economic welfare is the pet rant of my friend of many years Steve Kohlhagen, one of the most accomplished economists alive. Steve is a hard dog to keep on the porch. After a successful academic career at Berkeley, Steve invaded Wall Street as a derivatives guru, then became a successful novelist. You really need to read Steve’s political thriller, The Point of a Gun.
You will find the figure in line 160 of Table 2.4.5U, Personal Consumption Expenditures by Type of Product at the BEA website.


Great take Dr. John, thank you, appreciate it!