Want to Know How Consumers are Really Doing? Check the Manheim Index. Pickup Truck Inflation +3.0%.
August 8, 2019
Summary: The Manheim Index for July show that values of the nearly 200 million cars in people's driveways are up 2.6% over last July, a good positive consumption indicator. You can see the Manheim Index here.
To a first approximation, all major economic events start in the economy's balance sheet, not its income statement. The simple reason is that asset markets are huge relative to GDP. At the end of 2018, the value of US assets added up to $356 trillion, roughly 17x our $21 trillion annual GDP. roughly 30% of those assets ($106 trillion) are real assets like houses, cars, and trucks. Even small changes in values of real assets can be important for consumers, both because they impact net worth and provide sources of liquidity (think eBay). For vehicles, the Manheim Index is the best source of information. I watch it every month. You can see a chart of the Index above, and the historical data below. Click on their site. I think you will enjoy it.
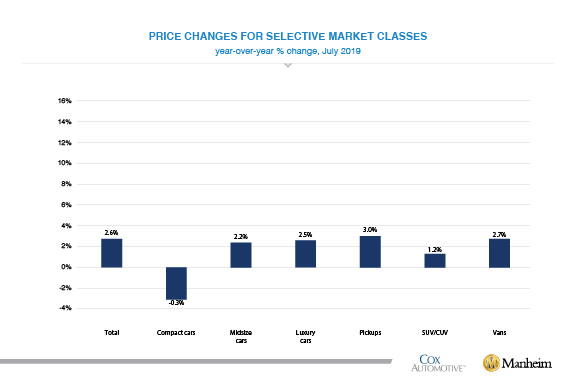
As you can see, the index for all vehicles is up +2.6% over the last year. In many ways, used car prices and home prices are better measures of inflation than the CPI that gets all the attention. Most of the CPI is made up of services (haircuts and guitar lessons) that don't compete with TBills and stocks for a home in people's balance sheets. At the moment, real asset price are rising faster than CPI prices, a positive indicator for spending on both goods and services. Real asset inflation gives you a better measure of real interest rates too.
Manheim also shows you which types of vehicle prices are rising. Notably, prices of pickup trucks are upmost of all, at +3.0%. Pickup prices are a good proxy for the liquidity of small service companies like plumbers and construction workers.
Dr. John


